- Moonshot Minute
- Posts
- Everyone saw the gains but almost no one understood why
Everyone saw the gains but almost no one understood why
The market follows a pattern... here's what it is

Donald Doge
December 19, 2025
Markets don’t reward what’s obvious. They reward what’s uncomfortable right up until it stops being painful.
If you were invested in the S&P 500 this year, you did fine.
Through late December, the index is up roughly 15–16%. That’s a perfectly respectable return.
But here’s the contrast that matters: in that same window, a cluster of assets most investors had written off produced gains measured not in tens of percent, but in multiples.
Gold is up roughly 60% year-to-date. Silver is up more than 110%. Gold‑mining equities advanced between 130% and 170%, depending on the index.
Several critical‑mineral strategies climbed 200%+. Copper‑related assets gained roughly 65% despite a sharp mid‑year correction.
Uranium is up more than 35% this year and remains over 1,000% above its prior cycle low.
Those results came from owning assets while they were still uncomfortable.
For most of the past decade, these assets were ignored in very concrete ways. Institutional portfolios allocated low single‑digit percentages, often below 2%, to commodities and resource equities.
Mining stocks represented well under 1% of global equity market capitalization.
Capital spending across many extractive industries ran below replacement levels for years, as investment flowed almost exclusively toward software, platforms, and balance‑sheet‑light growth models.
The narrative fit the positioning.
Physical assets were labeled cyclical, politically inconvenient, capital‑intensive, and structurally inferior to financial ones.
That story held…until the math changed.
Years of deferred investment collided with demand that refused to stay cyclical.
Electrification expanded into grids, data centers, and industrial processes. Defense spending rose as geopolitical risk hardened.
Food, energy, and materials moved from background inputs to front‑page policy concerns.
At the same time, sovereign debt loads ballooned, interest costs climbed, and the room for financial engineering narrowed.
Long‑term ratios that had been flat for decades began to break. Metals started outperforming bonds. Some metals began outperforming equities.
In several cases, prices broke above ranges that had capped them since the 1970s and 1980s.
That’s the kind of price action that occurs when an asset has been mispriced for a generation.
Every major market cycle follows the same psychological arc.
First, an asset is ignored. Then it’s argued with. Eventually, it’s accepted. Finally, it’s overowned.
Some of the most significant gains occur between the first two stages.
That is the core truth of this cycle.
These Five (5) Signals Appear Before the Crowd Wakes Up
To understand why these moves were identifiable before they became obvious, you must look at where pressure first appears.
The first signal: relative strength.
Long before these assets dominated performance tables, they began outperforming things that were supposed to be safer.
Precious metals started beating government bonds on a rolling basis. Commodity‑linked equities began outperforming long‑duration growth stocks.
Those shifts matter because they reflect capital quietly reassessing inflation, scarcity, and real‑world constraints.
The second signal: breadth.
This isn’t a one‑asset story.
Gold, silver, miners, industrial metals, energy inputs, and critical materials all began advancing within the same twelve‑month window.
When multiple segments across the value chain move together, physical commodities first, producers next, suppliers after that, the driver is constraint.
The third signal: persistence.
Temporary shortages resolve quickly. Structural ones don’t.
In several key commodities, supply deficits persisted for multiple consecutive years. Inventories failed to rebuild even after prices rose. Recycling offsets part of the gap, but not enough.
Meanwhile, new supply required 10‑ to 15‑year timelines under optimistic assumptions.
That combination, thin inventories and long lead times, is what turns neglect into inevitability.
The fourth signal: long‑term breakage.
Some of the most consequential moves occurred when assets broke above ranges that had held for four and five decades.
Multi‑decade bases do not resolve because of momentum traders or even a Reddit army.
They resolve because the economic conditions that created the range no longer apply.
The final signal: disagreement.
Even as prices advanced, the dominant commentary, the financial headlines, remained skeptical. Growth would slow, and demand would roll over. Eventually, technology would fix the problem, and if it didn’t, policy would intervene.
That tension between tightening data and lagging narratives is not a warning sign. It’s confirmation.
What’s ignored doesn’t become inevitable because people agree. It becomes inevitable because the math stops working.
🚀 Get Moonshot Alerts Instantly
Markets move in minutes. Your inbox can’t keep up.
Join the Moonshot VIP Text Service and get real-time alerts, portfolio updates, and first-move intelligence directly to your phone.
Be first to know. Anywhere.
The Moment the Trade Stops Being Safe
After years of neglect across all hard assets, capital began reallocating toward hard‑asset exposure in size. Generalist funds that had effectively zero exposure started lifting weights.
In asset classes representing less than 5% of global equity capitalization, even a one‑ or two‑percentage‑point shift in allocation becomes explosive.
It’s simple math, really.
You can see inevitability in positioning stress.
As prices rose, short interest declined and underweights narrowed. This, in turn, removes natural sellers.
When supply dries up at old prices, incremental demand moves markets faster and farther.
Then comes the volatility.
Early in the cycle, assets grind higher quietly. Later, pullbacks shorten, former resistance becomes support, and volatility expands as participation broadens.
Several resource‑linked markets this year experienced sharp corrections followed by rapid recoveries. In fact, it’s still happening now. You can even see it in some of our positions in the Premium Moonshot Minute Portfolio.
It’s a classic sign of institutional adoption rather than speculative excess, and it’s the reason why I’m so excited about the next handful of years.
What happens next is that the conversation starts to shift, and the headlines take a turn.
The conversation shifted from whether these moves made sense to explaining why higher prices were justified: supply deficits, long lead times, geopolitical risk, and inflation persistence.
Once the debate shifts from whether something should exist to how it should be valued, the asset is no longer fringe.
But inevitability is not the same thing as safety.
When an asset becomes inevitable, it is no longer repricing from neglect. It is repricing from underallocation. Returns can continue, but they become more volatile and more sensitive to timing.
Early in the cycle, the risk is being wrong.
Late in the cycle, the risk is being late, which is why you want to position yourself right at that Goldilocks stage… not too early, not too late.
Why the Biggest Gains All Happened at the Same Time
One asset doubling can be luck. Multiple assets doubling in the same year is structural.
This year’s gains were broad, synchronized, and phase‑driven.
Gold up ~60%. Silver up 110%+. Gold miners up 130–170%. Critical minerals up 200%+. Copper‑linked assets up ~65%. Uranium up 35%+ this year and 1,000%+ from the prior cycle low.
Those outcomes occurred together.
That tells you this was not a stock‑picking story. It was a phase‑alignment story.
Breadth mattered. Physical commodities moved first, then producers, and finally service providers and infrastructure suppliers followed.
When upstream, midstream, and downstream assets advance together, the driver is not narrative. It is constraint.
And remember that time horizons matter. These assets are resolving and breaking through 30‑ to 50‑year basing patterns, which means they don’t reprice gently or politely.
They gap, trend, and overshoot because decades of mispricing can and will unwind violently.
Capital math also matters. At the start of the year, entire sectors barely had single-digit percent presence in institutional portfolios.
Forcing even modest reallocations through markets that thin produces nonlinear results.
Add to that years of cost‑cutting and balance‑sheet repair, and price increases quickly translated into margin expansion and free‑cash‑flow inflection. Equity prices followed.
Skepticism delayed participation and kept trades from becoming crowded even as prices moved sharply.
Put together, these forces explain why this year produced and stacked so many 100%+ gains across multiple assets.
🚀 Get Moonshot Alerts Instantly
Markets move in minutes. Your inbox can’t keep up.
Join the Moonshot VIP Text Service and get real-time alerts, portfolio updates, and first-move intelligence directly to your phone.
Be first to know. Anywhere.
How to Spot the Next Opportunity Before It Looks Obvious
The practical question is not what worked. It’s about recognizing the next ignored asset before inevitability arrives.
I want everyone to become a Moonshot Minute Premium Member, but I get that not everyone can or even wants to join.
And even if you decide not to join Premium, I want you to have the framework that’s helped me all these years, because I believe that if I provide enough value, value eventually accrues to me.
So… Here it is:
Start with positioning. Assets representing small shares of global portfolios can reprice violently with modest reallocations.
Ask whether the market could absorb institutional demand easily.
If the answer is no, asymmetry exists.
Look for structural pressure, not cyclical noise. Persistent deficits, thin inventories, and decade‑long development timelines matter more than quarterly demand swings.
Watch ratios before headlines. When ignored assets outperform bonds and then equities while narratives lag, capital is already moving.
Pay attention to disagreement. Rising prices alongside persistent skepticism often signal opportunity, not danger.
But as always, though, size for phases, not heroics. Conviction matters early, and discipline matters later because none of it matters if you blow yourself up!
This framework tells you when to pay attention.
How We’re Applying This as 2025 Turns Into 2026
Since April, when we began deliberately applying this framework across the Moonshot Minute portfolio, the results have been instructive.
Across our closed positions, the average gain has been 63%. The four most recent closures finished at +88%, +140%, +108%, and +101%.
Those outcomes came from alignment, not leverage.
Each position shared the same setup: light ownership, structural pressure, improving relative strength, persistent disagreement, and enough time for inevitability to do its work.
As 2026 approaches, the opportunity set is already changing. Some assets are further along the curve. Others are entering the early stages that made 2025 so productive.
If you want to see how this framework is being applied going into 2026, what we’re exiting, what we’re building, and why, Moonshot Minute Premium is where that work lives.
The Only Principle That Actually Matters Going Forward
Every market cycle tempts investors to look for a secret. A new indicator. A better model. A faster signal.
The truth is simpler, and harder to practice.
Markets don’t move because people discover something new.
They move because enough people are forced to accept something universal: scarcity, constraint, time, and capital.
The assets that delivered the strongest gains in 2025 didn’t win because they were fashionable. They won because they spent years being ignored while the underlying math quietly worsened.
When that math finally surfaced in prices, the repricing was fast, uneven, and uncomfortable. Precisely the way real regime shifts always are.
That dynamic doesn’t end when a year does.
As 2026 approaches, the opportunity is already changing.
The work going forward isn’t to chase what already happened. It’s to recognize where inevitability hasn’t arrived yet.
If there is one thing to carry with you into next year, it’s this…
The market doesn’t reward certainty. It rewards positioning before certainty arrives.
That principle explains our success in 2025. It also frames what comes next.
Everything else, indicators, narratives, and predictions, is secondary.
Double D
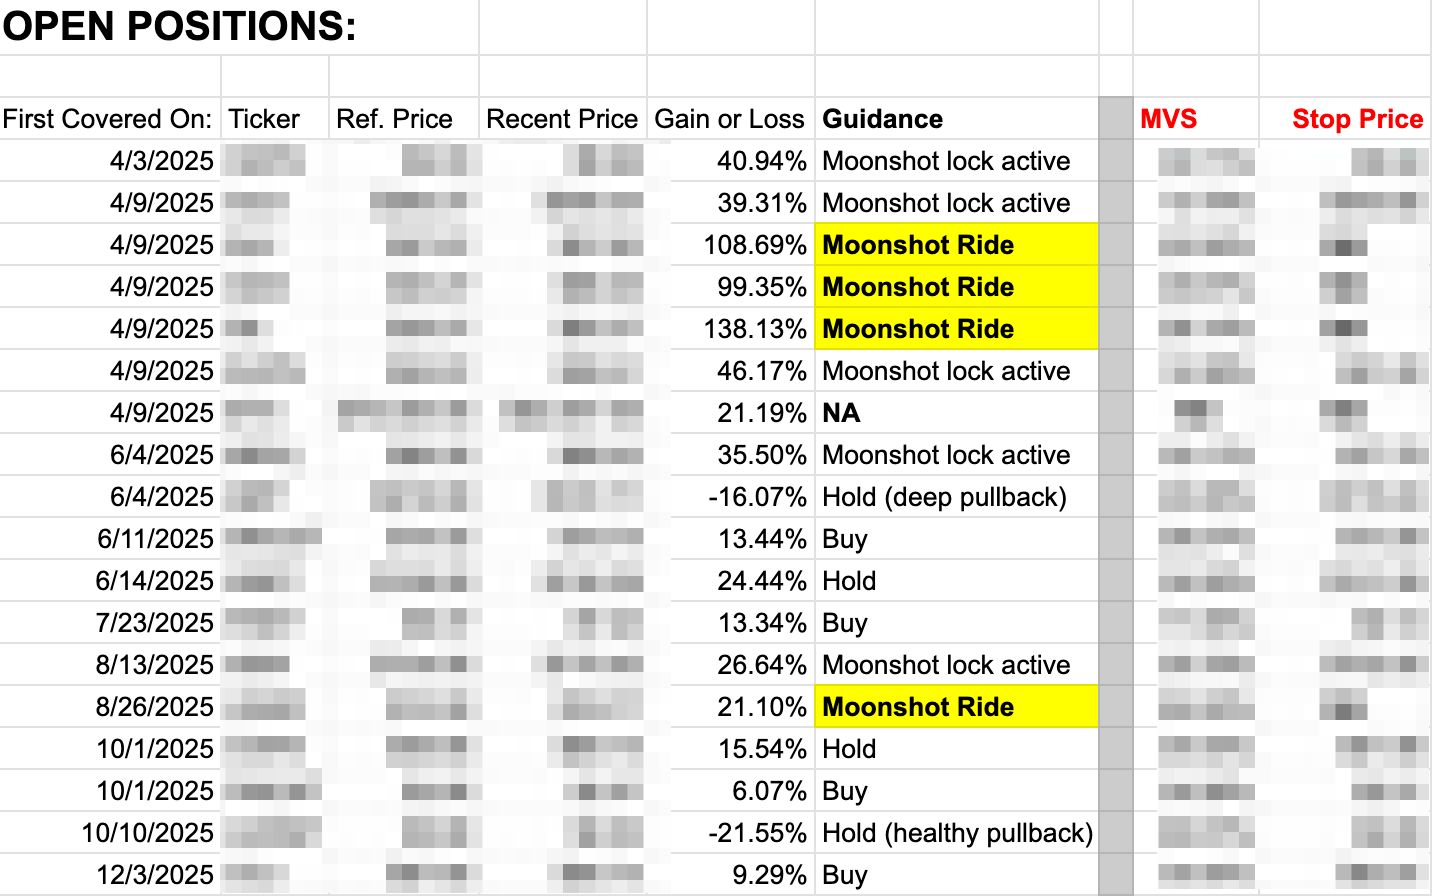
P.S. Here’s our current open portfolio with the tickers blurred out since that’s only for Premium. As you can see, of the 18 open positions, all but 2 are up, and many are still in buy range: (keep scrolling down for the Premium Section). Of course, I can’t guarantee next year will be as successful or more (no one can), but we’ve positioned the odds in our favor.
🔓 Premium Content Begins Here 🔒
In today’s Premium Section, you’ll find TWO recommendations that hit our Moonshot Ride. What that means is they both have hit at least a 100% gain. Congratulations to all the Premium Members who got in.
I hope you’ve been paying attention because many of our picks are currently beating the S&P by up to 4-to-1 this year.
Most financial newsletters charge $500, $1,000, even $5,000 per year. Why? Because they know they can.
I don’t.
I built my wealth the old-fashioned way, not by selling subscriptions.
That’s why I priced this at $25/month, or $250/year.
Not because it’s low quality, but because I don’t need to charge the typical prices other newsletters charge.
One good trade, idea, or concept could pay for your next decade of subscriptions.
The question isn’t ‘Why is this so cheap?’ The question is, ‘Why would I charge more?’
P.S. If this newsletter were $1,000 per year, you’d have to think about it.
You’d weigh your options. You’d analyze the risk.
But it’s $25 a month.
That’s the price of a bad lunch decision.
And remember, just one good idea could pay for your subscription for a decade.